Module 3: Install the Distributed Tracing Stack
You can integrate Red Hat OpenShift Service Mesh with Red Hat OpenShift distributed tracing data collection to instrument, generate, collect, and export OpenTelemetry traces, metrics, and logs to analyze and understand your software’s performance and behavior.
|
Integrating Red Hat OpenShift distributed tracing platform with Red Hat OpenShift Service Mesh is made of up two parts:
Installing
-
Red Hat OpenShift distributed tracing platform (Tempo) and
-
Red Hat OpenShift distributed tracing data collection.
Navigate to the subdirectory: 030-tracing-install
|
Prerequisites
Make sure you have installed the following operators:
-
Tempo Operator (provided by Red Hat)
-
Red Hat build of OpenTelemetry (provided by Red Hat)
Task 1: Install MinIO Object storage
Object storage is required and not included with the Distributed Tracing Platform. You must choose and set up object storage by a supported provider before installing the Distributed Tracing Platform.
We are going to install MinIO for this workshop:
oc apply -f ./00-minio/namespace/minio created
secret/minio-secret created
persistentvolumeclaim/minio-pvc created
deployment.apps/minio created
service/minio-service created
route.route.openshift.io/minio-api created
route.route.openshift.io/minio-ui created
job.batch/create-minio-buckets createdWait until the MinIO deployment is ready by running the following command:
oc get all -n minioNAME READY STATUS RESTARTS AGE
pod/create-minio-buckets-xf64r 0/1 Completed 0 70s
pod/minio-68bcd4565-45kt8 1/1 Running 0 71s
NAME TYPE CLUSTER-IP EXTERNAL-IP PORT(S) AGE
service/minio-service ClusterIP 172.30.90.153 <none> 9000/TCP,9090/TCP 71s
NAME READY UP-TO-DATE AVAILABLE AGE
deployment.apps/minio 1/1 1 1 71s
NAME DESIRED CURRENT READY AGE
replicaset.apps/minio-68bcd4565 1 1 1 71s
NAME STATUS COMPLETIONS DURATION AGE
job.batch/create-minio-buckets Complete 1/1 33s 70s
NAME HOST/PORT PATH SERVICES PORT TERMINATION WILDCARD
route.route.openshift.io/minio-api minio-api-minio.apps.ocp4.rhlab.de minio-service api edge/Redirect None
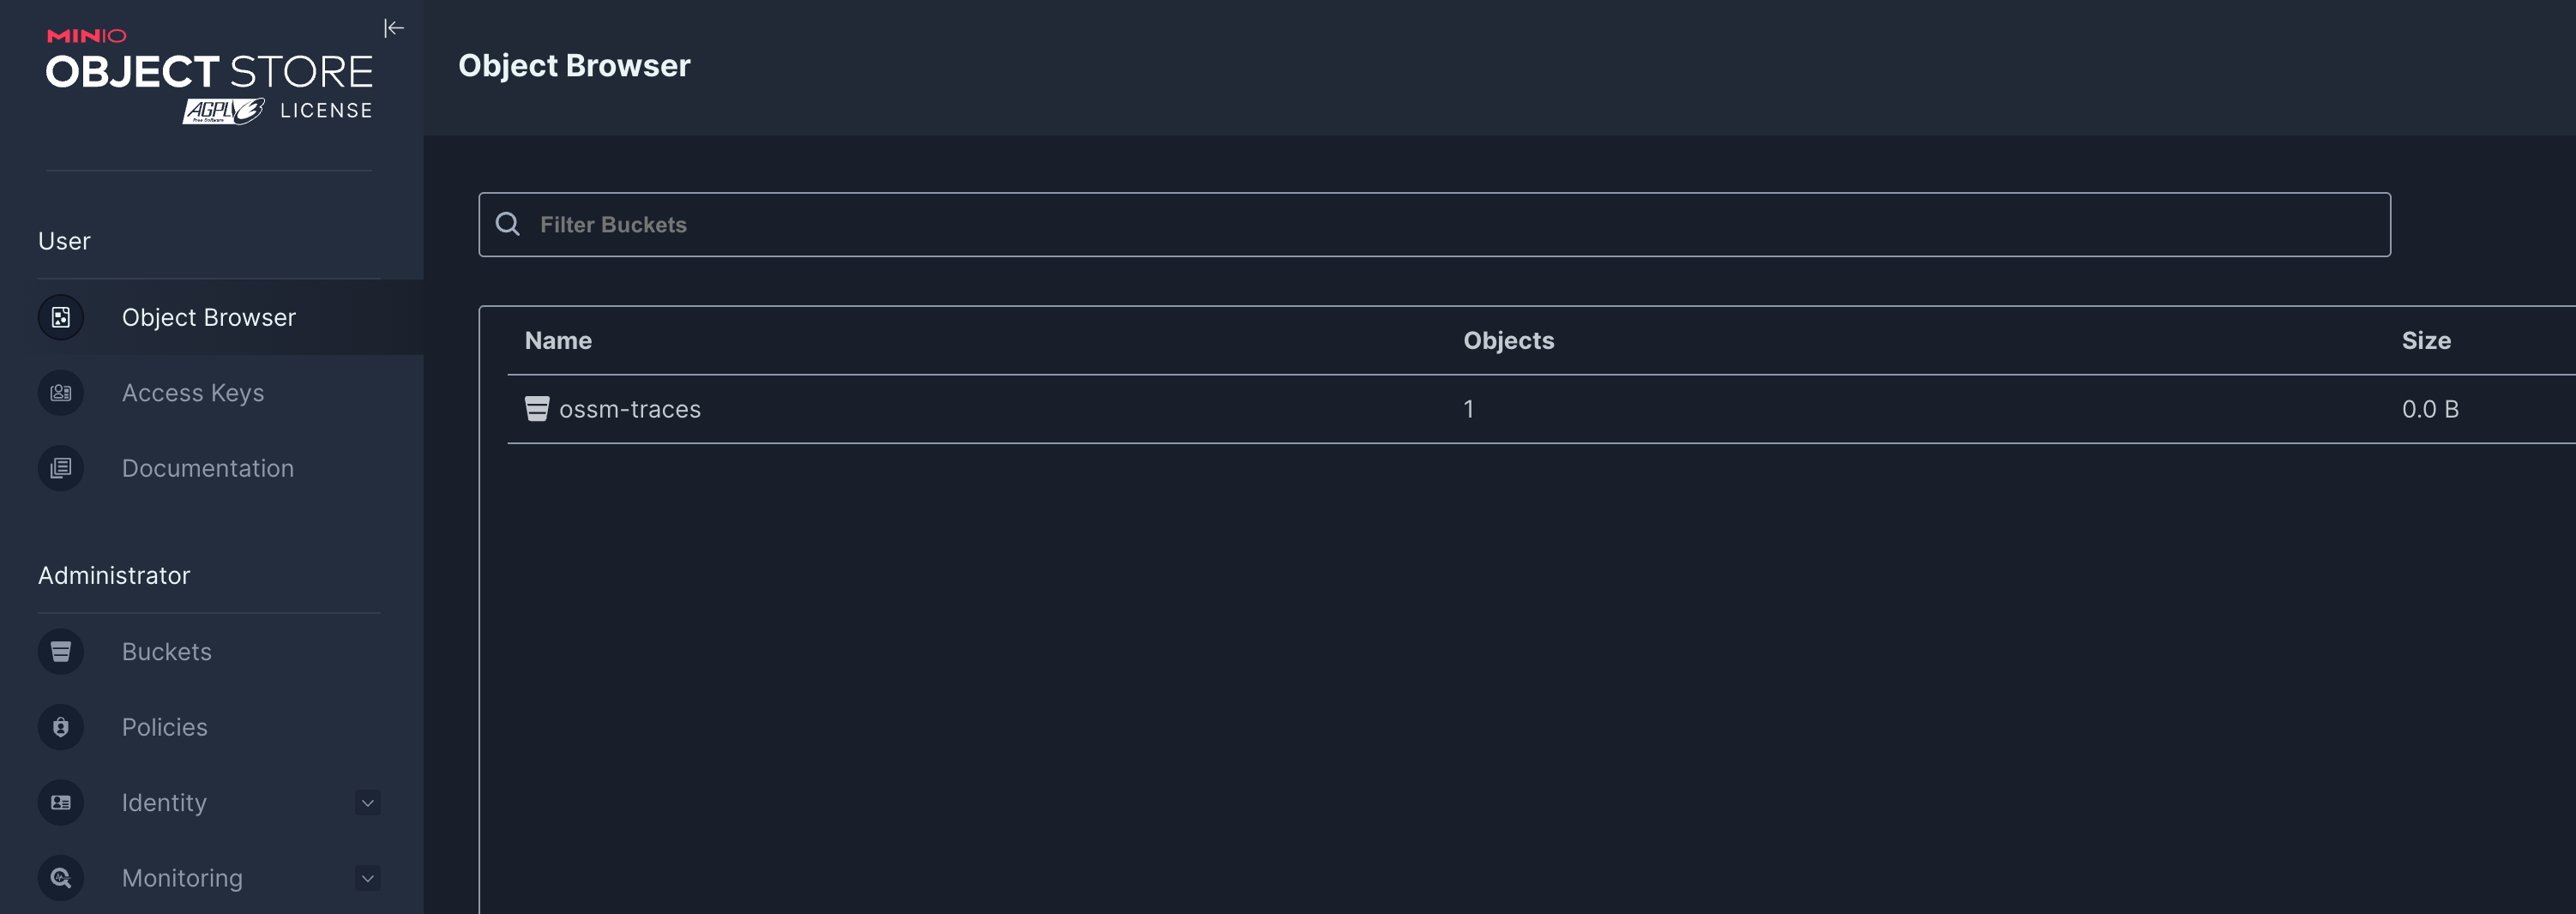
route.route.openshift.io/minio-ui minio-ui-minio.apps.ocp4.rhlab.de minio-service ui edge/Redirect NoneWhen MinIO is ready, get the MinIO UI URL from the Route by running the following command:
echo "https://$(oc get routes -n minio minio-ui -o jsonpath='{.spec.host}')"
Log in with the user: minio and password: minio123
|
Task 2: Create the namespace for the Tempo Stack deployment
TempoStack is Red Hat’s supported distribution of Grafana Tempo, a distributed tracing backend. It stores and indexes traces in a cost-efficient, object-storage-friendly way (S3, GCS, etc.) and is designed to scale without needing heavy indexing like traditional tracing systems.
Create a new namespace for the Tempo Stack deployment:
oc apply -f 01-namespace.yamlTask 3: Create a MinIO access for Tempo Stack
Tempo Stack needs access to the MinIO instance to store tracing data. Create a secret in the tempostack namespace with the MinIO access credentials:
oc apply -f 02-minio-secret.yamlTask 4: Deploy the Tempo Stack
This CR creates a simple TempoStack deployment, that exposes the Jaeger UI, which visualizes the data, via a route and uses our MinIO instance for storage of tracing data.
apiVersion: tempo.grafana.com/v1alpha1
kind: TempoStack
metadata:
  name: simplest
  namespace: tempostack
spec:
  storage:
    secret:
      name: minio-traces-secret
      type: s3
  storageSize: 1Gi
  resources:
    total:
      limits:
        memory: 2Gi
        cpu: 2000m
  template:
    queryFrontend:
      jaegerQuery:
        enabled: true
        ingress:
          route:
            termination: edge
          type: route
oc apply -f 03-tempostack.yamlVerify that the status of all TempoStack components is Running and the conditions are type: Ready by running the following command:
oc get tempostacks.tempo.grafana.com simplest -n tempostack -o yamlstatus:
components:
compactor:
Running:
- tempo-simplest-compactor-66b5d4d9f8-s8t9d
- tempo-simplest-compactor-69fb86dbd7-5q9kx
distributor:
Running:
- tempo-simplest-distributor-5d94c84f4b-dqpwq
gateway: {}
ingester:
Running:
- tempo-simplest-ingester-0
querier:
Running:
- tempo-simplest-querier-95c8cb75-bpccz
- tempo-simplest-querier-7bf85d9cd4-g6zpj
queryFrontend:
Running:
- tempo-simplest-query-frontend-57bbc44c48-rbsg4
- tempo-simplest-query-frontend-6cb7ddc4f-z69m8Verify that all the TempoStack component pods are running by running the following command:
oc get pods -n tempostackNAME READY STATUS RESTARTS AGE
tempo-simplest-compactor-6bb589bdf5-5dxv6 1/1 Running 0 4m19s
tempo-simplest-distributor-7c7bcc457c-cctr7 1/1 Running 0 4m20s
tempo-simplest-ingester-0 1/1 Running 0 4m20s
tempo-simplest-querier-69f46cf4b7-zdrb7 1/1 Running 0 4m20s
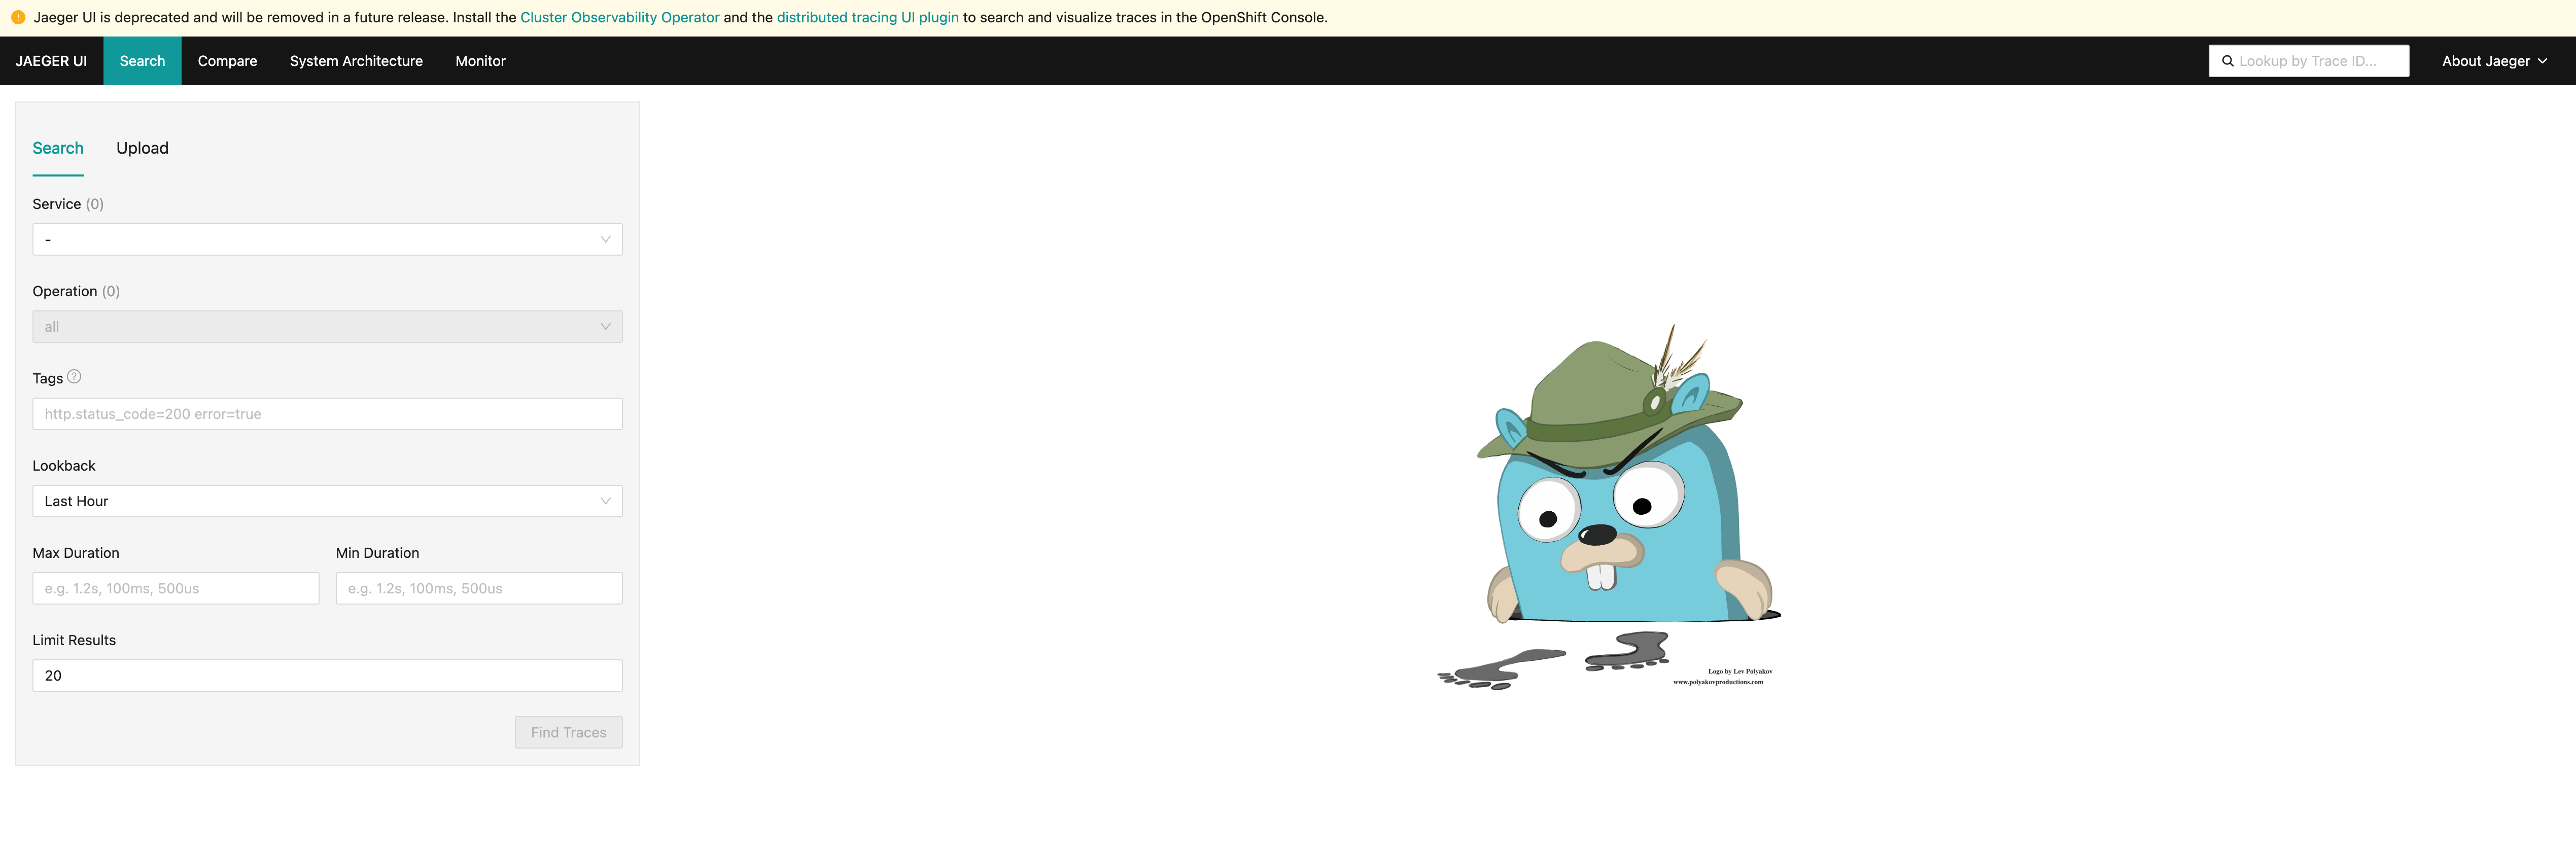
tempo-simplest-query-frontend-6bdf9c49c9-twflm 4/4 Running 0 4m20sGet the Query Frontend URL from the Route by running the following command:
echo "https://$(oc get routes -n tempostack tempo-simplest-query-frontend -o jsonpath='{.spec.host}')"Follow the URL to open the Jeager Dashboard in your web browser.
Task 5: Install the OpenTelemetryCollector
Next, install the OpenTelemetryCollector resource in the istio-system namespace.
This collector will receive traces from Istio and will export them through GRPC to Tempo Stack.
kind: OpenTelemetryCollector
apiVersion: opentelemetry.io/v1beta1
metadata:
  name: otel
  namespace: istio-system
spec:
  observability:
    metrics: {}
  deploymentUpdateStrategy: {}
  config:
    exporters:
      otlp:
        endpoint: 'tempo-simplest-distributor.tempostack.svc.cluster.local:4317'
        tls:
          insecure: true
    receivers:
      otlp:
        protocols:
          grpc:
            endpoint: '0.0.0.0:4317'
    service:
      pipelines:
        traces:
          exporters:
            - otlp
          receivers:
            - otlp
oc apply -f 04-otel-collector.yamlCheck that the OpenTelemetry Collector pod is running by running the following command:
oc get pods -n istio-systemNAME READY STATUS RESTARTS AGE
grafana-6b6dfdf46c-zgr98 1/1 Running 0 19h
istiod-69b5fc4898-b7x4x 1/1 Running 0 19h
kiali-686d9b5f68-j5x8z 1/1 Running 0 73m
ossmconsole-74bdffdfd7-xv56c 1/1 Running 0 64m
otel-collector-59798f79d4-gcjxf 1/1 Running 0 82sTask 6: Configure Tracing in Service Mesh
Configure Red Hat OpenShift Service Mesh to enable tracing, and define the distributed tracing data collection tracing providers in your meshConfig:
apiVersion: sailoperator.io/v1
kind: Istio
metadata:
  name: default
  namespace: istio-system
spec:
  namespace: istio-system
  version: v1.27-latest
  values:
    pilot:
      trustedZtunnelNamespace: ztunnel
    profile: ambient
    meshConfig:
      enableTracing: true          (1)
      extensionProviders:          (2)
      - name: otel
        opentelemetry:
          port: 4317
          service: otel-collector.istio-system.svc.cluster.local
      discoverySelectors:
      - matchLabels:
istio-discovery: enabled| 1 | enableTracing: true - Enables tracing in the mesh configuration. |
| 2 | extensionProviders - Defines the OpenTelemetry collector as the tracing provider for the service mesh. |
oc apply -f 05-istio-update.yaml| Congratulations! You have successfully installed and configured the Distributed Tracing Stack with Red Hat OpenShift Service Mesh. |