Module 2: Enable Service Mesh Observability
Red Hat OpenShift Observability provides real-time visibility, monitoring, and analysis of various system metrics, logs, and events to help you quickly diagnose and troubleshoot issues before they impact systems or applications.
The two layers of ambient mesh generate different metrics:
ztunnel generates TCP metrics for all service traffic.
Waypoint proxies generates request and response metrics for HTTP, HTTP/2 and gRPC traffic.
Navigate to the subdirectory: 020-observability-install
|
Task 1: Enable OpenShift user workload monitoring
You can integrate Red Hat OpenShift Service Mesh with user-workload monitoring to enable observability in your service mesh. User-workload monitoring provides access to essential built-in tools and is required to run Kiali, the dedicated console for Istio.
If the cluster-monitoring-config is not available, we create it with:
kind: ConfigMap
apiVersion: v1
metadata:
  name: cluster-monitoring-config
  namespace: openshift-monitoring
data:
  config.yaml: |
    enableUserWorkload: true
oc apply -f 01-user-workload-monitoring.yamlor if available, make sure enableUserWorkload is true:
oc -n openshift-monitoring patch configmap cluster-monitoring-config -p '{"data":{"config.yaml":"enableUserWorkload: true"}}'oc get pods -n openshift-user-workload-monitoringNAME READY STATUS RESTARTS AGE
prometheus-operator-675f9d4b96-f9zxd 2/2 Running 0 8d
prometheus-user-workload-0 6/6 Running 0 8d
prometheus-user-workload-1 6/6 Running 0 8d
thanos-ruler-user-workload-0 4/4 Running 0 8d
thanos-ruler-user-workload-1 4/4 Running 0 8dTask 2: Create ServiceMonitor and PodMonitors
PodMonitor objects must be applied in all mesh namespaces, including the Istio control plane namespace, because OpenShift Container Platform monitoring ignores the namespaceSelector spec in ServiceMonitor and PodMonitor objects.
oc apply -f 02_1-service-monitor.yamloc apply -f 02_2-pod-monitors.yamlTask 3: Enable Access Logging
| Gateway and waypoint access logs are off by default. They can be enabled using Istio’s Telemetry API. |
To enable access logging for all gateways and waypoints in the mesh, create a Telemetry object in the istio-system namespace:
apiVersion: telemetry.istio.io/v1
kind: Telemetry
metadata:
  name: enable-access-logging
  namespace: istio-system
spec:
  accessLogging:
    - providers:
      - name: envoy
oc apply -f 02_3-enable-access-logging.yamlTask 4: Install Grafana
Istio comes with Grafana dashboards which offer summaries of Istio’s metrics, allowing you to drill down by service or workload.
Step 1: Create a Cluster role binding for the grafana and kiali service accounts, so that they have access to OpenShift Monitoring:
oc apply -f 03-monitoring-crb.yamlStep 2: Install Grafana:
oc apply -f 04_1-grafana.yamlserviceaccount/grafana created
configmap/grafana created
service/grafana created
deployment.apps/grafana created
configmap/istio-grafana-dashboards created
configmap/istio-services-grafana-dashboards createdoc get pods -n istio-systemNAME READY STATUS RESTARTS AGE
grafana-6b6dfdf46c-zgr98 1/1 Running 0 37s
istiod-69b5fc4898-b7x4x 1/1 Running 0 55mStep 3: Create an OpenShift Route for Grafana:
oc apply -f 04_2-grafana-route.yamlStep 4: Create a Service Account Token for the grafana serviceaccount:
oc apply -f 04_3-grafana-token.yamlWait a few seconds, then extract the token:
oc get secret grafana-token -n istio-system -o jsonpath='{.data.token}' | base64 -dStep 5: Configure the Prometheus Datasource in Grafana:
Open the Grafana URL and navigate to Connections → Data sources.
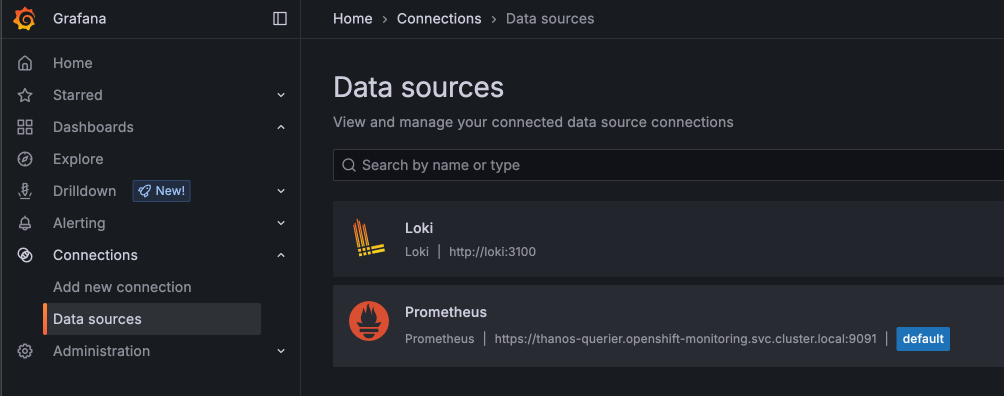
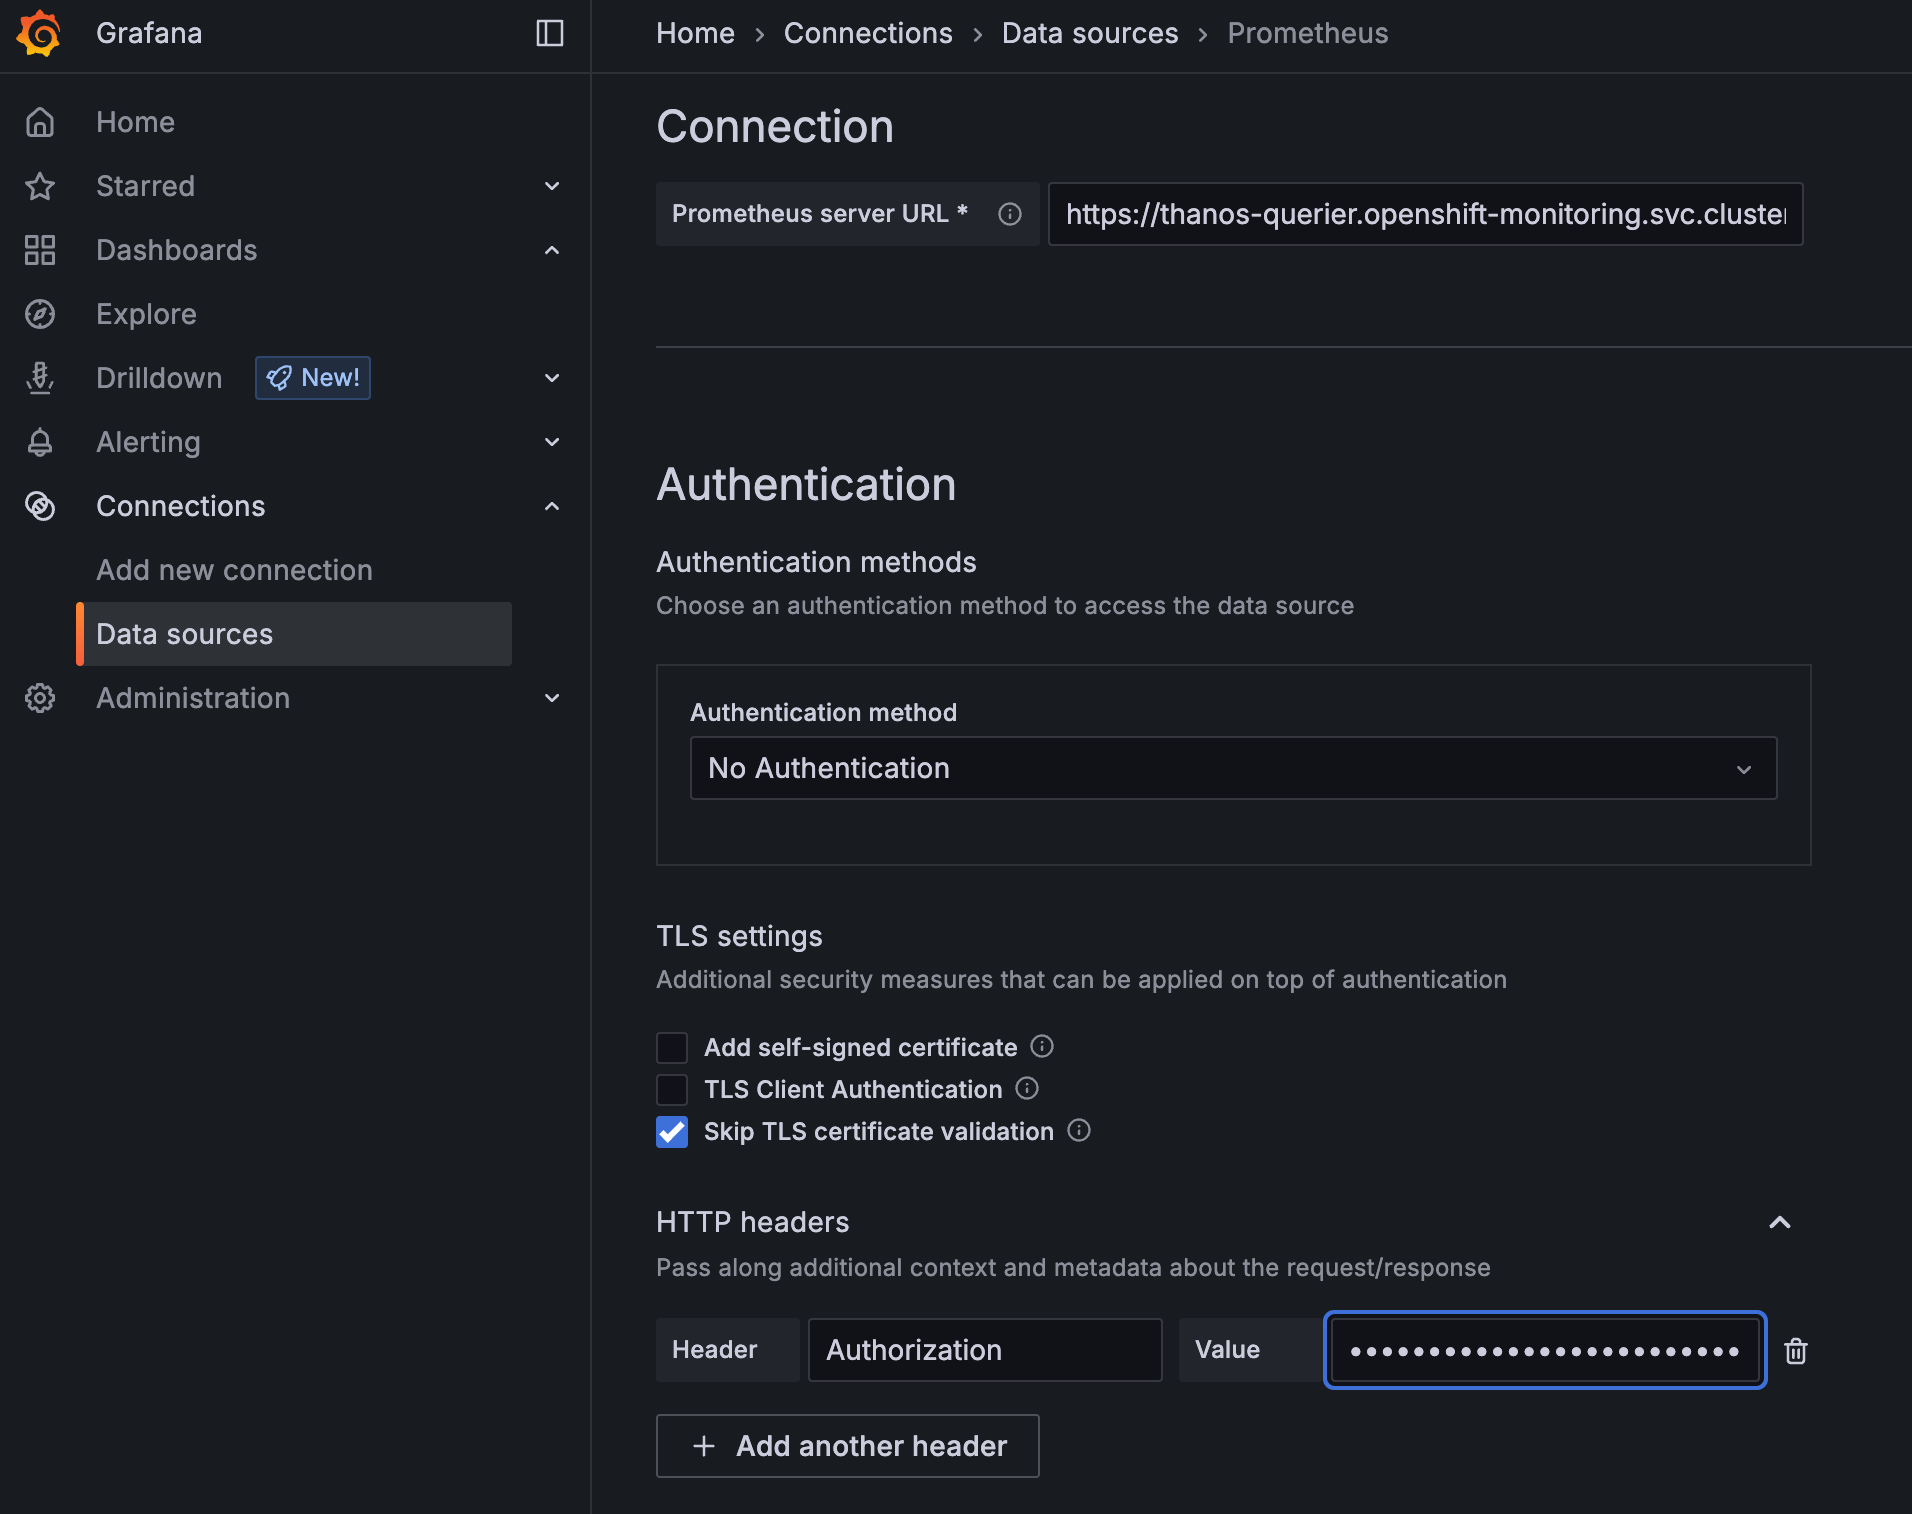
Select Prometheus and edit the Authentication settings:
Authentication
Authentication Method: No Authentication
TLS settings
Skip TLS certificate validation
HTTP Headers
Header: Authorization
Value: Bearer your-grafana-sa-token
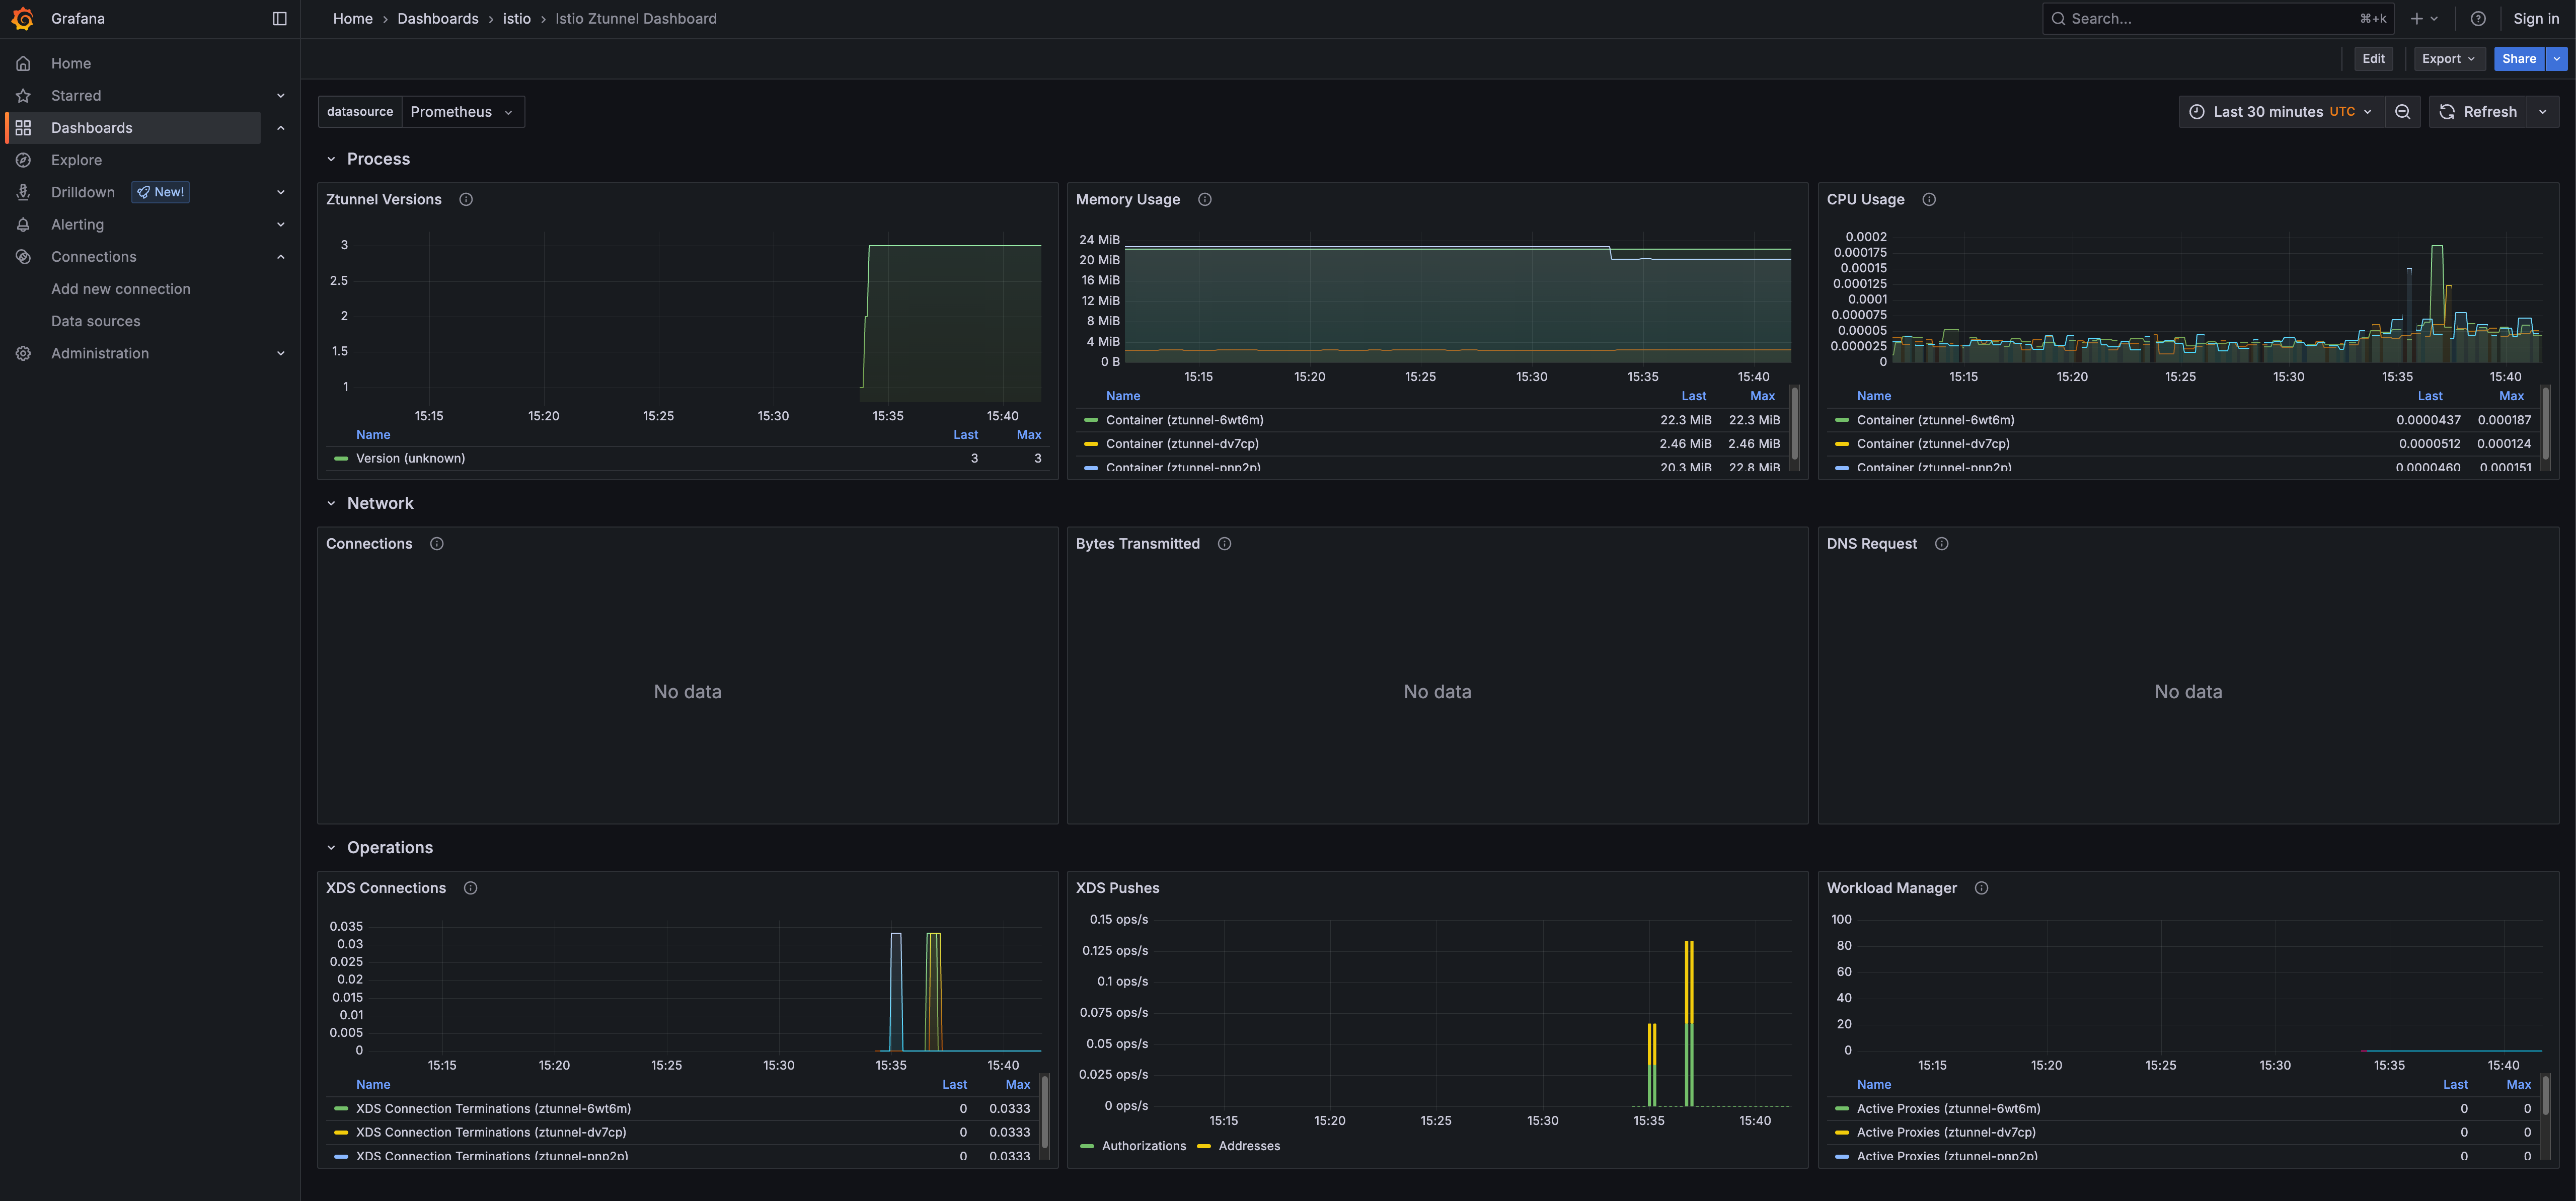
Navigate to Dashboards → Istio and explore the available dashboards, i.e. the Istio Ztunnel Dashboard
Task 5: Install Kiali
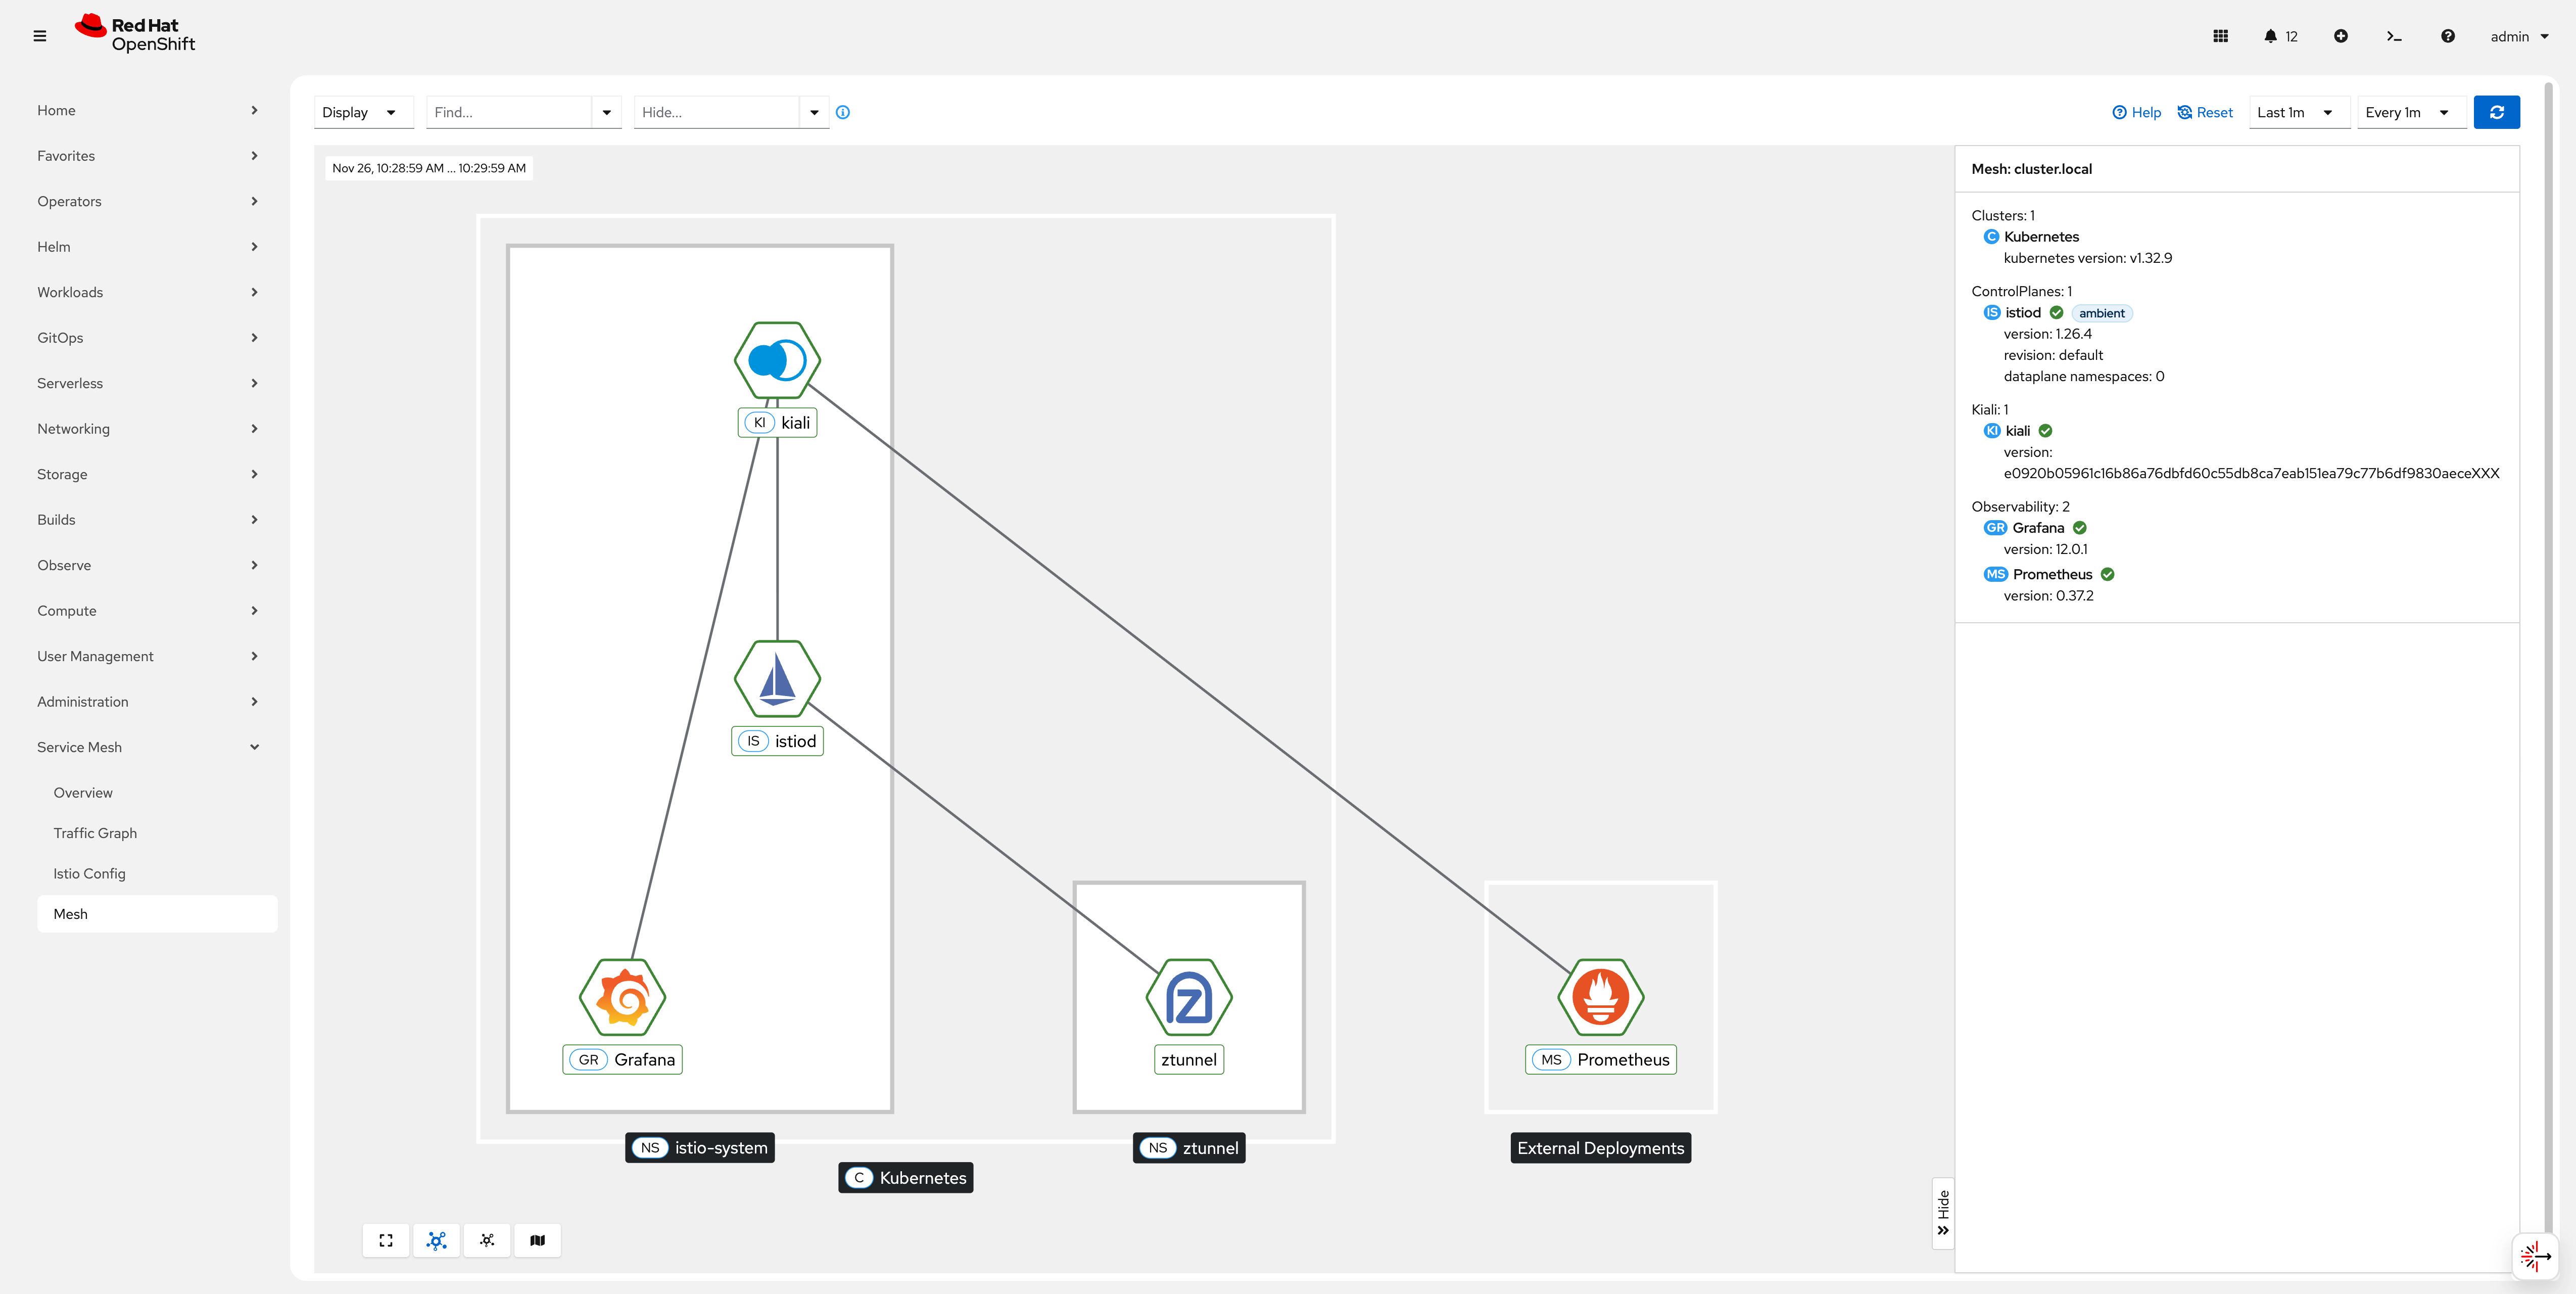
Kiali provides dashboards, observability, and robust configuration and validation capabilities. It shows the structure of your service mesh by inferring traffic topology and displays the health of your mesh. Kiali provides detailed metrics, powerful validation, access to Grafana, and strong integration with the Red Hat OpenShift distributed tracing platform (Tempo).
When running in Istio ambient mode, Kiali introduces new behaviors and visualizations to support the Ambient data plane. Here you find further information.
Now install the Kiali Custom Resource:
apiVersion: kiali.io/v1alpha1
kind: Kiali
annotations:
  ansible.sdk.operatorframework.io/reconcile-period: 60s
metadata:
  name: kiali-user-workload-monitoring
  namespace: istio-system
spec:
  deployment:
    cluster_wide_access: true
    discovery_selectors:
      default:
      - matchExpressions:
        - key: istio-discovery
          operator: In
          values:
          - enabled
    logger:
      log_level: info
  external_services:
    grafana:
      enabled: true
      internal_url: 'http://grafana.istio-system:3000'
    prometheus:
      auth:
        type: bearer
        use_kiali_token: true
      thanos_proxy:
        enabled: true
      url: https://thanos-querier.openshift-monitoring.svc.cluster.local:9091
oc apply -f 05-kiali.yamlWait a few seconds until Kiali is ready.
oc get pods -n istio-systemNAME READY STATUS RESTARTS AGE
grafana-6b6dfdf46c-6lmks 1/1 Running 0 6m29s
istiod-685b946668-tnh46 1/1 Running 0 8m49s
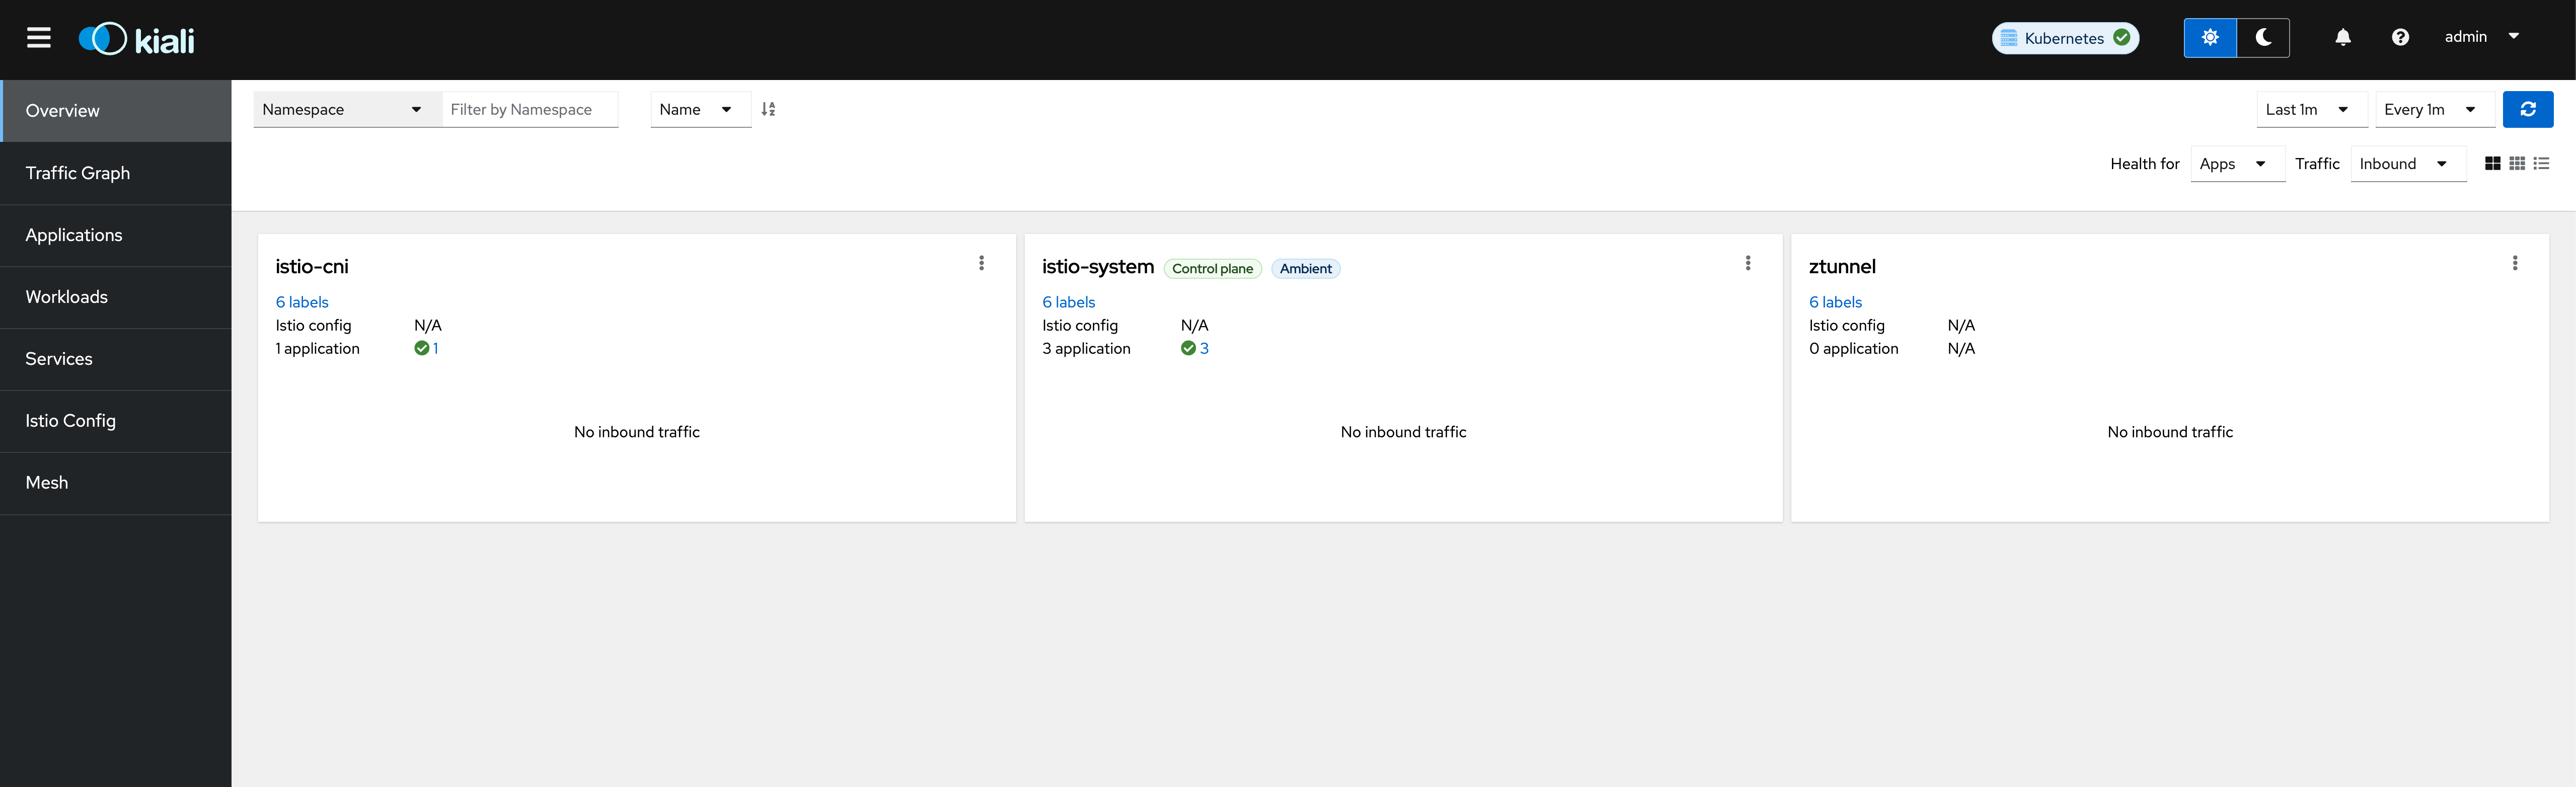
kiali-6c6764bdf8-c9zf7 1/1 Running 0 2m33sWhen the Kiali deployment is ready, get the Kiali URL from the Route by running the following command:
echo "https://$(oc get routes -n istio-system kiali -o jsonpath='{.spec.host}')"Follow the URL to open Kiali in your web browser.
Task 6: Install the OpenShift Service Mesh Console Plugin
The OpenShift Service Mesh Console (OSSMC) plugin extends the OpenShift Container Platform web console with a Service Mesh menu and enhanced tabs for workloads and services.
Here you find further information.
Now install the Service Mesh Console (OSSMC) plugin:
oc apply -f 06-ossm-console.yaml| The OpenShift Console pods will restart after a few seconds and you might have to login to OpenShift again. |
Verify that the Service Mesh category is added in the main OpenShift Container Platform web console navigation.
| Congratulations! You have successfully installed and configured observability for Red Hat OpenShift Service Mesh in Ambient Mode. |